
In the fall of 2017-2018, the Bay District Schools implemented two of Achieve3000’s proven literacy solutions: Smarty Ants and Achieve3000 Literacy.
District leaders felt these solutions were a great fit, because they are proven to accelerate reading comprehension, fluency, writing proficiency, and vocabulary development. They used Smarty Ants for students in grades K-2 and Achieve3000 Literacy for all their elementary students, as well as for students in grades six through ten who needed intervention based on the district’s RTI model.
Following the 2017-2018 school year, Achieve3000 conducted an analysis of Bay District Schools students’ performance on the NWEA MAP (Grades K-2) and the Florida State Assessment for English language arts (FSA ELA) (Grades 4-10) tests and what if any impact their usage of Smarty Ants and/or Achieve3000 Literacy during the school year had on that performance.
Students enrolled in kindergarten through second grade participate in the NWEA MAP Growth, which measures their achievement in reading, language usage, math, and science. Students take the test three times per year (fall, winter, and spring).
NWEA MAP Growth provides RIT scores, based on a stable scale that measures performance regardless of age, grades, or grade level. Students also receive a projected growth value that shows how much a student is expected to grow in RIT from one administration of the test (e.g. fall) to another (e.g. spring).
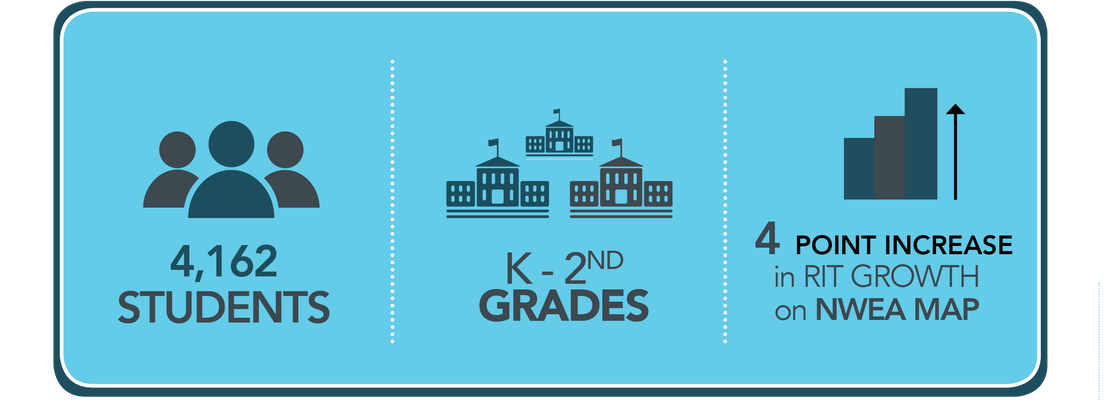
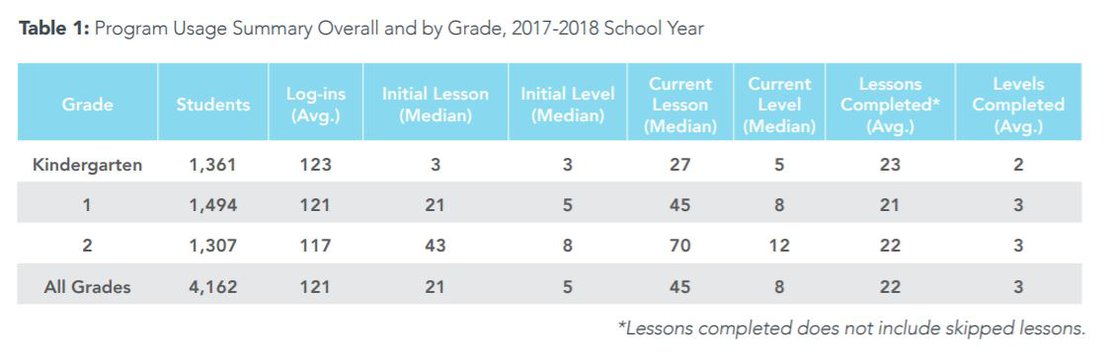
Over the course of the 2017-2018 school year, participating students in kindergarten through second grade logged in an average of 121 times and completed 22 lessons. Kindergarten students completed more lessons than the other grades (23 lessons). Overall, students made 50 percent progress toward their end-of-year goal, with kindergartners making the most progress (59%). See below for detailed usage data.
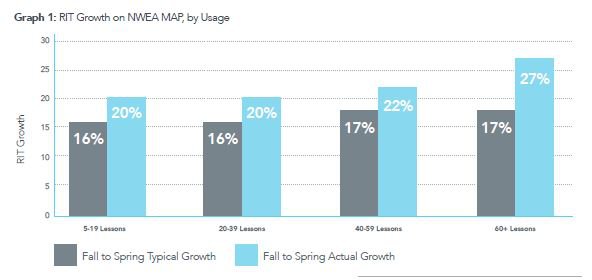
On average, Smarty Ants students demonstrated RIT growth of 20 points, compared to a typical RIT growth as reported by NWEA of 16 points, on average. Kindergarteners showed the most growth (23 points), compared to typical growth for their grade level of 17 points. Students who completed more lessons in Smarty Ants had greater RIT growth. Notably, students who completed 60 Smarty Ants lessons or more saw RIT growth of 27 points compared to typical growth of 17 points.
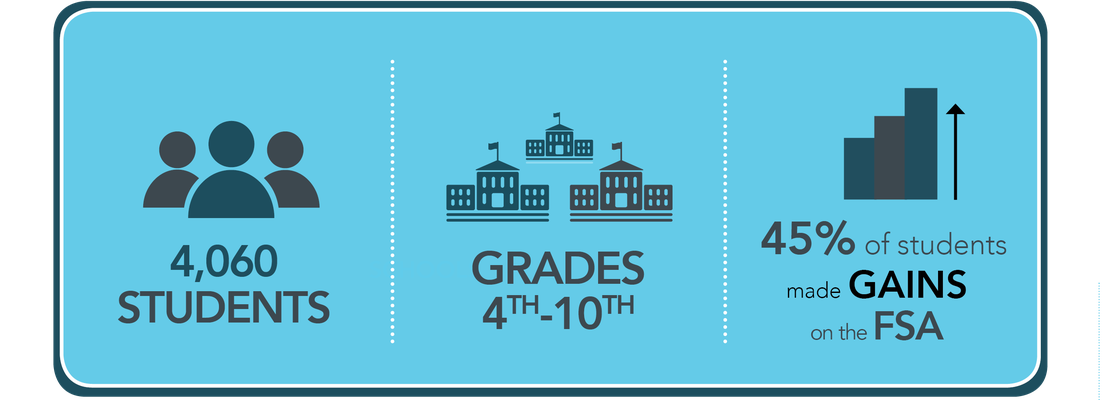
Students enrolled in the 4th through 10th grades participate in the FSA which measures student achievement in English language arts and math. Students take the test once annually, at the end of the school year.
Raw scores on the FSA are converted to scale scores using an Item Response Theory (IRT) model, which considers statistical characteristics (i.e. whether an item is easier to guess) of an item and whether the student answered the item correctly.
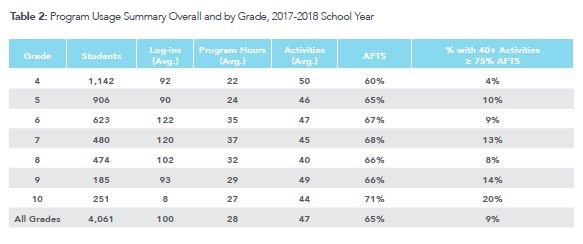
Over the course of the 2017-2018 school year, participating students in grades 4-8 logged in an average of 100 times, completed 47 lessons (i.e. multiple-choice activity sets), and demonstrated an average first-try score of 65 percent on embedded assessments. Students in Grade 4 completed more lessons than the other grades (50), and tenth graders had the highest average first-try score (AFTS) of 71 percent. See Table 2 for detailed usage data.
Overall, students demonstrated an average Lexile? growth of 98L, which exceeded their average expected growth of 83L. Students with greater quantity and quality of practice saw greater Lexile gains. Specifically, students who completed 80 or more lessons and had an average first-try score of at least 75 percent on the embedded assessment achieved gains of 281L on average, which was three and half times their expected growth of 81L (see Graph 2). In addition, the percentage of Bay District Schools students in this sample who were on track for college & career readiness increased from seven percent to twelve percent over the course of the 2017-2018 school year.*
85% of elementary school students who spent one hour per week learning with Achieve3000 Literacy and maintained an average score of 75% on embedded assessments within each lesson made learning gains on the FSA.
In 2017-2018, there were 28,076 ethnically diverse students enrolled in the Bay District Schools. Of these, 32% were students of color. Across the district, 18 percent of students needed special education services, and three percent were English language learners. Fifty-three percent is qualified for free and reduced lunch.
This report relies on internal Achieve3000 usage and Lexile data as well as NWEA MAP data for grades K-2 and FSA ELA data for grades 4-10 from Fall 2017 and Spring 2018. To examine the impact of Achieve3000 usage on Lexile growth, two sample groups of 4,162 students in grade K-2 and 4,061 students in grades 4-10 who met the following inclusion criteria were identified: